Download White Paper: Creating a Lean Warehouse
Abstract
Lean got its start in factories and for many years was called Lean Manufacturing. However, if you analyze movement of people, there is often a greater opportunity in creating a Lean Warehouse. When your warehouse is Lean the tools and information you need to receive, pick and pack are right where they are needed. The order flow is streamlined, with no unnecessary paper and all of the information needed is in the hands of the operators. The layout is designed to put floor stock, shelf items and rack items in the optimal locations relative to the dock-doors. SKUs are located to minimize movement of the heaviest items that are picked most often and stock items that are lighter and lower velocity are further away and up on higher levels.
We will case study a few projects, showing you the analysis and design that goes into Creating a Lean Warehouse.
Understand the Current State
- Process Flow Mapping of Warehouse Processes and Order Information Flow
- Spaghetti Diagrams & Time Studies of Warehouse Operations
Lean Practitioners always seek to understand the current state to identify the non-value-added steps. Future state warehouses are designed to make sure the non-value-added work is eliminated or reduced. We primarily use three Lean tools to identify and eliminate non-value-added work: Process Flow Mapping, Spaghetti Diagrams and Time Studies.
Process Flow Mapping: Streamline Warehouse Processes and Order Information Flow
When working on a warehouse layout, the first thing we do is map the “business processes” and information flow. This is to identify and eliminate non-value-added steps in the purchasing-to-receiving-and-putaway and the order-pick-pack-ship processes. Once all steps are mapped, we classify each step as either green, yellow or red:
- Green: Value-Added to the Customer
- Yellow: Non-Value-Added but Necessary
- Red: Non-Value-Added and should be eliminated
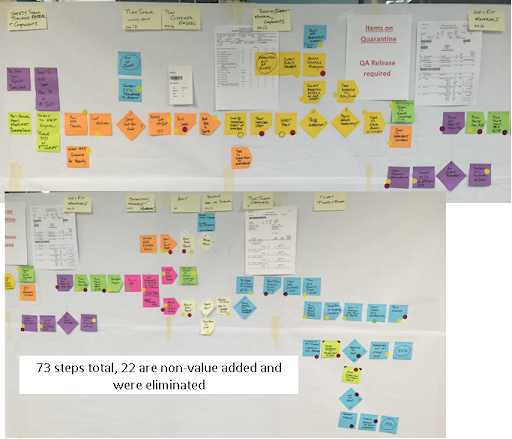
Figure 1 has an example of a process flow map of two major warehouse processes (purchasing-to-receiving-and-putaway and the order-pick-pack-ship). As you can see there are 73 steps in these two processes, with 22 identified as red, which will be designed out of the future state information flow.
Figure 1: Warehouse Process Flow Map
Spaghetti Diagrams and Time Studies: Non-Value-Add in Labor and Material Movement
All warehouse operations are time-studied and spaghetti-mapped to understand labor and material movement in warehouse operations. The data will help identify the non-value added steps required in the current layout and provide insights into the new layout and new processes. The time study provides the quantitative proof of how much time is wasted in warehouse processes. The spaghetti diagram provides a compelling visual to support the need for change.
Figure 1 shows the need for this change at a mid-size ecommerce company. Below is a spaghetti diagram for an operator picking all items in an ecommerce order. The current state layout is causing the operators to travel to almost every corner of the warehouse.
Figure 2: Order-Picking Spaghetti Diagram (1216 feet travelled)
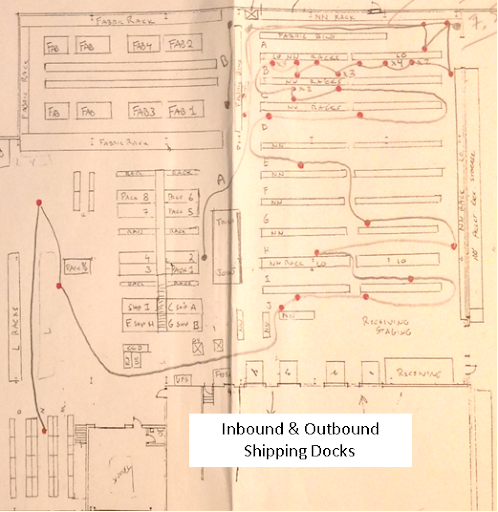
This spaghetti diagram showed us many opportunities for improvements.
- Racking/shelving is aligned 90 degrees to the inbound and outbound dock-doors, blocking off the natural inbound and outbound flow
- Pack/ship workstations are not directly in front of the outbound dock-door creating extra movement to put boxes or pallets in delivery trucks
- A light assembly area is using important warehouse space (upper left corner of the warehouse) when these items are rarely on orders
- Most SKUs on this order are stocked very far away from the dock-doors
- One storage area, in the lower left corner of the warehouse, is far away from all other racking/shelving/floor-stock, guaranteeing extra travel for these items
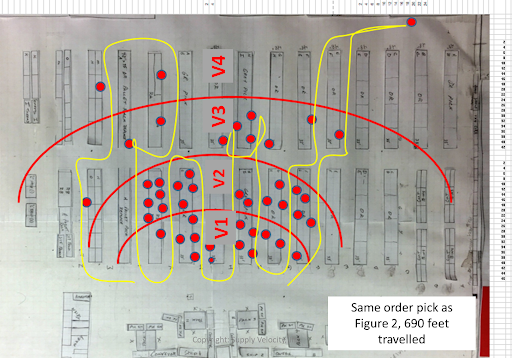
(For comparison purposes, Figure 4 shown on the following page, depicts the Lean / Future State layout of the warehouse shown above in Figure 2 as Current State.)
Figure 3 shows an example of a Time Study for receiving. While less visually interesting than the Spaghetti Diagram, time studies capture the detailed non-value-added steps that turn into process improvement action items and ideas for improving the layout. In addition, this information allows us to quantify specific improvements, calculating a return on investment when justifying expenditures.
Figure 3: Inbound Receiving Time Study
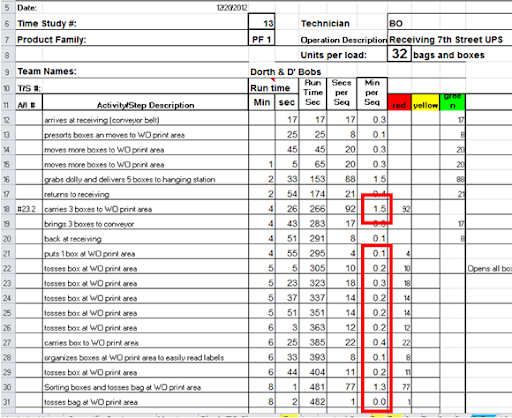
Figure 4: Order Picking in New Lean Layout (same order as figure 2)
Designing the Lean Warehouse
- The Ideal Lean Warehouse Layout
- Velocity, Size & Weight Analysis
- SKU Codes: V1, V2, V3 (Different from SKU Classification A, B,C)
- SKU Locations
- Choosing Racking, Shelving, or Floor-Stock
- Bin Location Coding
- 5S Visual Management
With a good understanding of the labor movement and time required in the current warehouse we can now design the Lean Warehouse. This is a combination of best practices, using ideas generated during the process flow mapping, spaghetti diagrams and time studies, and considering item velocity, size and weight.
The Ideal Lean Warehouse Layout
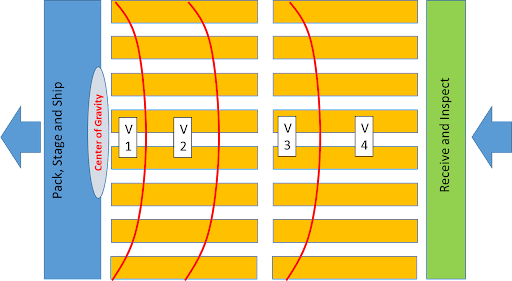
An idealized Lean warehouse is depicted in Figure 5. It is unlikely your building looks exactly like this but ideally we would want as many of these characteristics as possible:
- The inbound receiving docks to be on one side the building and the outbound shipping docks on the other.
- There is space allocated for receiving to organize products for putaway and to do required incoming receiving inspection. (I know that in an ideal Lean world there would be no need to do receiving inspection because all suppliers are certified, but the real world can be different.)
- Racks, shelving and floor locations are aligned with the flow of the incoming and outgoing dock doors. Specifically, it is more important to align them with the outbound dock doors because in most warehouses picking is a much larger component of labor than putaway.
- There is sufficient space in front of the outbound dock doors for the packing lines or shrink-wrapping outbound pallets and staging boxes or pallets for loading on trucks (or drones!).
- There is a defined “center of gravity” which is the busiest part of the warehouse. This is usually located in the staging area by the packing / shrink-wrapping lines.
- Items are located by velocity, with the heaviest and fastest-moving items located closest to the center of gravity. Lower velocity and lighter weighing items are located further back and higher up. The slowest moving items are located near the back of the warehouse close to receiving.
- Note: SKU location should be based on picking-velocity to receiving. Items are usually received in larger quantities than they are picked.
Figure 5: The Ideal Warehouse Layout
Velocity, Size/Weight Analysis / SKU Locations / Floor-stock, Racking or Shelving
Instead of ABC we use V1/V2/V3/V4 as the warehouse velocity code designation for SKU warehouse location importance. Where ABC SKU classification may be determined by item profitability, unit volume, and/or how many customers buy an item, the warehouse velocity code is a function of the number of times an item is picked, the size and weight.
Velocity is the number of lines on sales orders for each SKU. For weight and size we often categorize items as Small (S), Medium (M), Large (L) and Extra-Large (XL). Small and medium items are often stocked on shelving, although we will often separate small from medium parts. Large items are often stocked on pallet racking and extra-large items are often floor stocked.
The fastest moving items are often the smallest but to consider size and weight we will have shelving, racking and floor stock around the center of gravity (COG).
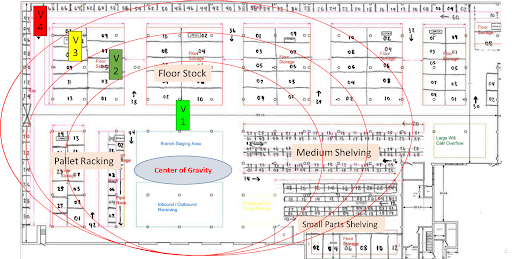
In Figure 6 on the following page, we show a real Lean Warehouse Layout for a parts and equipment distributor, with spaces for all sizes of items. The approximately concentric ovals show the locations of V1 through V4 items. Not shown in this top-view is that V1 items that are small, medium or large would be located on the most convenient shelves or be on the lowest pallet level of pallet racking.
SKU Locating during the Transition/Move
When doing the actual transition/move to the Lean Warehouse Layout, we have found it is practical to set up fixed locations for V1 and V2 items and fill in the extra spaces with V3 and V4 items. V1 and V2 will get the locations closest to the center of gravity and on the most convenient levels of shelving and racking. Since V1 and V2 items are a minority of the total number of SKUs in most warehouses, it is a best practice to physically tag these items to make the move to the new location visually easy for the people moving items. V3 and V4 will fill up the rest of the floor/rack/shelf space in the new layout. It is not realistic to give fixed locations for all items because the business typically cannot know the exact space required for all SKUs over the entire year. By making sure V1 and V2 items have the space needed at their maximum stocking levels, in the best picking locations, you will maximize productivity over the entire year.
Bin Location Coding
Bin location coding is an important aspect to reducing labor of picking and eliminating “looking around” in warehouses without warehouse management systems. We created a detailed whitepaper explanation of options.
Figure 6: Warehouse Layout with Small, Medium, Large and Extra-Large Parts on Shelving, Racking, Floor Stock
5S Visual Management
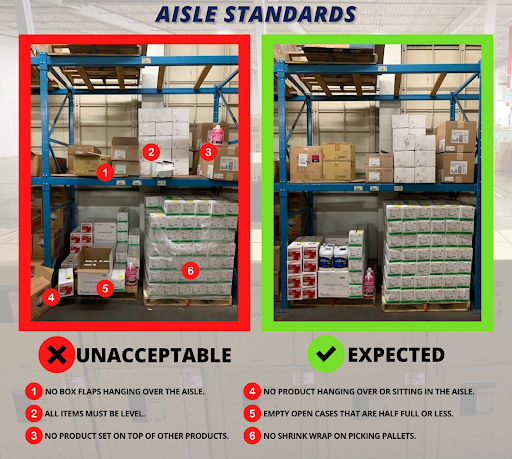
The 5S’s are well known in manufacturing and industry. The application in warehousing is similar. At Supply Velocity we give careful attention to the 4th S, Standardization. Figure 7 below shows one example of achieving standardization in visual organization. This poster is placed throughout the warehouse to help ensure safety, cleanliness and maximal productivity for the people picking product.
Figure 7: 5S Standardization Poster
Mitch Millstein, Ph.D.
Supply Velocity, Inc.
mitch@supplyvelocity.com
(314) 406-4962
November 2021
Ask us your Lean, Six Sigma, or Supply Chain question.
We’re the experts! We’ll get back within 48 hrs. with a valuable response.
"*" indicates required fields
“We used Supply Velocity on our Warehouse optimization project. One of the key characteristics of Supply Velocity is that they listened to our requirements and provided a clear path for our Warehouse processes using lean tools and our future sales growth as objectives.”
“Your process encourages this group to work together, better communicate and have fun doing it.”
“Supply Velocity’s Lean Six Sigma System has given us new tools to help improve our sales performance. We have learned new ways to analyze our business which makes problem solving more accurate and has made us better leaders.”
“Supply Velocity created visibility within our Assurance Services Group… visibility of performance, Client-service, employee satisfaction and processing time. Using the Supply Velocity System, Audit Report Cycle time is down over 50%. We are using his strategies to create greater Client loyalty.”
“In a time of volatile supply chain disruption, Supply Velocity is helping us develop Demand and Supply Planning processes to proactively tackle these new challenges. They are genuine partners, working with our team, facilitating and teaching.”
“Myerson engaged Supply Velocity, specifically Ray Davis to visit our plant in Trinidad to conduct a two day assessment of our production procedures and provide us feedback on areas for improvement and where applicable, areas for future analysis.Put simply, we got everything we paid for and in addition to more in depth analysis, we got specific tasks that were immediately actionable. Our local management team found Ray to be engaging, highly credible and insightful based on his wide experience. In other words the cultural differences and lack of specific industry knowledge weren’t impediments to things we could implement immediately and on our own. In a nutshell it was money well spent and will pay itself back many times over.”
“We engaged with Supply Velocity to help us embed process improvement at all levels of the business. Our team learned from Mitch to let the data drive decisions, to use Lean tools to help us see our processes critically and objectively, and to create a control plan to manage all of the tasks that were the outcome of the data study.The project turned out to be very significant to the company and most importantly, our customers. We reduced our customer wait times by 40%, and cut in half the labor cost to fulfill customer orders.
Some results are not able to be measured. However, as a result of this project, we have started to build a Lean mindset and culture, which is part of our strategic mission to save our customers money. Supply Velocity has been a valued partner in this mission.”
“I am thrilled to provide this testimonial for Supply Velocity and their outstanding work in implementing Lean Warehouses and processes at Crescent Parts & Equipment through the COVID pandemic. With their data-first focus and Mitch’s exceptional coaching and experience, they transformed our business into a more supply chain-oriented organization, enabling us to grow while prioritizing employee safety and creating a better work environment. Supply Velocity’s expertise in Lean methodologies and their comprehensive evaluation of our customers have been instrumental in optimizing our operations and increasing customer satisfaction. We highly recommend Supply Velocity to any company seeking to implement Lean processes and enhance their supply chain efficiency.”
“Supply Velocity gave us the tools to analyze our business and processes based on the facts and numbers versus our perceptions. Our common quote was “Let the numbers lead us”. The key for our organization was how quickly we moved from classroom to actual project initiation. We were able to jump in, start using the tools and see a difference right away.
The get-into-action approach was good for our culture.”
“We are pleased that Essex selected Supply Velocity, Inc. as our Lean Implementation Partner. At one facility, we have saved over $350,000 in work-in-process inventory, reduced throughput time from 2 weeks to minutes and increased inventory turns 3 to 8 times per year. All these results are in just 6 months. Our return of investment is very high.”
“Mitch Millstein and his team helped guide our shop fabrication division in the re-layout of our custom pipe and steel fabrication facility when we moved into a new building. It is not only the results but how he helped. We were involved in every step. I personally did time studies and was able to see the non-value added steps required to manufacture in our old layout. When we created our new layout, everyone was involved, from the executive team to our direct labor force. With Mitch’s help we increased our throughput by a 3x multiple, while providing more competitive prices to our clients as a result of the efficiency improvements.This has enabled us to not only make more money but also to expand our commercial reach and serve more, and larger customers. I would recommend Supply Velocity to any company that wants to make improvement in supply chain and operations.”
“For several years we have worked with Supply Velocity to support us with their expertise on Lean Operations and Supply Chain Management. Supply Velocity has helped us implement Lean, improve our inventory systems, and educate our people. They are professionals who are always available to help us as needed.”
“Closure Medical recently completed a major reorganization in order to enhance our ability to rapidly create innovative medical devices. We hired Supply Velocity to help us map out the process and service flows of the new organization that would maximize our product development process (PDP). In four weeks, Supply Velocity helped us envision a new PDP structure, develop measures and accountability for each step, and gain consensus within the organization. Supply Velocity’s focus on speed and accountability helped us complete a critical project in a timely fashion.”
“Many thanks to all three Supply Velocity presenters. I think you guys took a very difficult time for learning and capitalized on everyone’s time and training needs. I truly hope this helps your business as this was a considerable undertaking on the part of Supply Velocity. Outstanding!!”
“In 2015 we began working with Dr. Mitch Millstein to optimize our inventory locations supporting e-commerce and in-store inventory needs. From this work we developed a new omni-channel warehousing and inventory plan that entirely redefined our approach to warehousing, inventory management, store distribution and fulfillment. As a result of the analyses by Dr. Millstein we have begun the move to an improved omni-channel design by reassigning MSAs to new warehouses, greater leveraging of in-store inventories to satisfy e-commerce demands, and exploring acquisitions of new warehousing space in strategic locations. We have already seen an improvement of $300,000 from both more efficient shipping strategies due to better inventory management.”
“Isolating a problem, finding short, and long term solutions with measurable results is what was promised and results is what was delivered by Supply Velocity. Upon launch of the Lean Six Sigma Selling System, we knew more about our customers, our products, and were able to create a solid plan to increase sales of our most profitable products. Within months of implementation, our booked sales jumped 60% and our most valued customers were getting direct, active, and calculable attention.”
“Supply Velocity has provided the technical expertise and political capital to move our project forward. They have just the right amount of push and the right amount of support. Supply Velocity has helped us make real changes to improve efficiencies in logistics without jeopardizing our performance. We’re happy and our customers are happy.”
“C&R was struggling with labor productivity. The construction crews were often missing materials that they needed to do their work. This caused significant idle time. Supply Velocity, Inc. and C&R used value stream mapping and visual management tools to make dramatic improvements in operations. Most importantly, two years later C&R is sustaining and improving on the implementation. C&R’s return on investment was 11:1. C&R had a record year last year in both sales and profits and would not have been able to pull it off without the changes Supply Velocity, Inc. helped us make.”
“We are using Supply Velocity’s Lean Six Sigma methods to analyze a variety of processes including rationalizing SKUs (stock-keeping-units). By using math to evaluate SKUs we took some of the emotion out of our decisions. We expect significant increases in sales and productivity from reducing poor performing SKUs.”
“In the spring of 2003, the St. Louis Area Chapter of the American Red Cross engaged Supply Velocity, Inc. to perform a study and make recommendations to streamline office processes, maximize cash flow in purchasing and warehousing and restructure and enhance our maintenance department. Supply Velocity, Inc.’s process was methodical, flexible, staff-oriented, inclusive and, above all, trackable.In the last six months, our Chapter has realized expense savings of over $380,000 annually, and significant improvement in intra-company service levels has been attained. Supply Velocity, Inc. will return to the Chapter periodically throughout the next 18 months to audit our newly implemented processes. We have been pleased with our results and Supply Velocity, Inc.’s professionalism.”
“We used Supply Velocity to rethink our sales process. By analyzing the entire process we found wasted time in our Sales, Admin and Operations departments. Streamlining this process created extra time for each Sales Rep, allowing them to spend more time with Customers and increase the value we add. Gross profit margins are up 40%!We are now using Supply Velocity to help us rethink our entire Strategic Plan.”
“Supply Velocity has helped Clean succeed in a number of ways. First, they provided the education that kicked off our Lean Process Improvement journey. They also facilitated a number of large supply chain and process improvement projects including: 1) building quality into our direct-labor productivity incentive program, 2) designing the layout of our garment warehouse, and 3) streamlining our route service process.We have integrated the methods that Supply Velocity taught us into our management and strategic planning. In the process our quality measurement has improved 22% from 2013 to 2015, we have reduced required annual labor by 2200 hours from the garment facility layout project and we’ve seen 50% decrease in error rate. Obviously the numbers speak for themselves, but just as important, Supply Velocity has been fun to work and have become true partners. They have “taught us how to fish” so our internal teams are able to implement change on their own, with the skills we learned from Supply Velocity. This relationship has been invaluable.”
“Our experience with Supply Velocity was one of the best values we have ever had from a consulting project. Cyril Narishkin brought a structured lean methodology, invaluable experience and engaging facilitation skills to help us streamline a very complex and disjointed sales order process. Just as importantly, our team now has the knowledge and process competencies to address other business improvement opportunities going forward.”
“Anheuser-Busch Precision Printing had been implementing Lean Operations on our own for the past two years. We needed to move faster and partnered with Supply Velocity, Inc. Through Supply Velocity, Inc.’s mathematical workflow balancing and visual management tools, dramatic improvements were achieved. The entire converting operation was rearranged based on Lean principles. The result is a 20.6% productivity improvement, enabling us to operate with 23 fewer people in production.”
“Supply Velocity is driving instrumental change in our inventory management processes. This is critical for us to be competitive in a supply chain environment with numerous disruptions. They are making change happen, which can be challenging in a 182 year old organization.”
“In thirty years of hiring consultants, Supply Velocity, Inc. was the first to tell me what they were going to do, set a price they stuck to and substantially exceed my expectations. I have recommended them to friends and acquaintances. They were true partners in assisting with the turnaround of an acquisition we had been struggling with for two years.Their math-based technology, solid down-to-earth facilitation skills, and positive, patient and enthusiastic attitude combined to make our implementation of Lean a very rewarding experience.
We increased our production by 50% in the first month of implementation and continue to see improvements. Improvements have not only been realized in productivity, but also in quality and morale. We have increased profitability by $2M on flat sales of $10M.
Based on Supply Velocity, Inc.’s integrity and our results, I will continue to refer them to others and utilize them in the future as we expand our company through acquisitions.”
“The role of the Erie Insurance Marketing Department has been evolving over the past several years – from a support role to a more critical role of driving growth in our organization. Because of our increased workload and desire to prioritize the most critical projects, we hired Supply Velocity to teach us the skills of Lean Six Sigma.Participants included the Promotions, Market Research and Agency Licensing sections of the Marketing Department.
We learned valuable tools to help us to prioritize based on the voice of the customer.
I firmly believe these skills made a difference in how we work every day. We are moving new projects forward, eliminating or changing ineffective processes, and we are a much stronger department. We continue to use the tools to help us with our highly-complex and time-consuming projects. Supply Velocity helped us to accomplish our goals.”
